
Service area coverage: your complete guide to finding the best mobile signal (5 proven steps)
Introduction
Service area coverage is not a guarantee. 95% call success outdoors defines "très bonne couverture" per ARCEP's 2025 methodology. Guessing your signal is a costly mistake.
As an expert in telecom compliance, I’ll show you the insider method to verify coverage with precision. This guide reveals the hidden variables in official maps and delivers a 5-step framework to secure reliable service.
Inaction risks dropped calls, failed transactions, and contractual disputes with operators. For businesses, poor coverage due diligence can jeopardize an entire site investment.
What is the single most reliable tool for comparison? How do you decode the official color codes from green to red? Why does your indoor signal differ from the map's promise?
We analyze the latest ARCEP Q2 2025 departmental data and the updated "Mon réseau mobile" interface. Our structured methodology cuts through marketing claims to give you actionable, regulator-grade insight.
Ready to map your connectivity? This 6-minute read is your definitive signal check. ⚡ Let’s get you covered.
Why checking your mobile coverage is your first step to reliable service
Mobile coverage checking is not a luxury; it's a critical verification step to avoid the frustration of dropped calls and failed data connections. It means confirming your ability to connect to a mobile network at a specific location to access voice, SMS, and data services with reliable quality. According to the ARCEP's 2025 methodology, this verification is based on a 95% success rate for maintaining a call for at least one minute outdoors with a standard terminal.
Skipping this check is the primary reason for service dissatisfaction. Common scenarios where verification is essential include moving to a new home, switching providers, planning a business site, or monitoring 5G deployment in your region. For instance, a business relocating its office without checking coverage could face operational disruptions, impacting customer service and internal communications. The official "Mon réseau mobile" tool, updated in 2025, provides the regulator-grade data needed for this precise assessment.
This proactive step transforms you from a passive consumer to an informed user. It allows you to choose an operator based on empirical evidence of their network performance at your exact location, not just marketing promises. By starting with a coverage check, you lay the foundation for consistent connectivity, which we'll now methodically achieve through the official procedure.
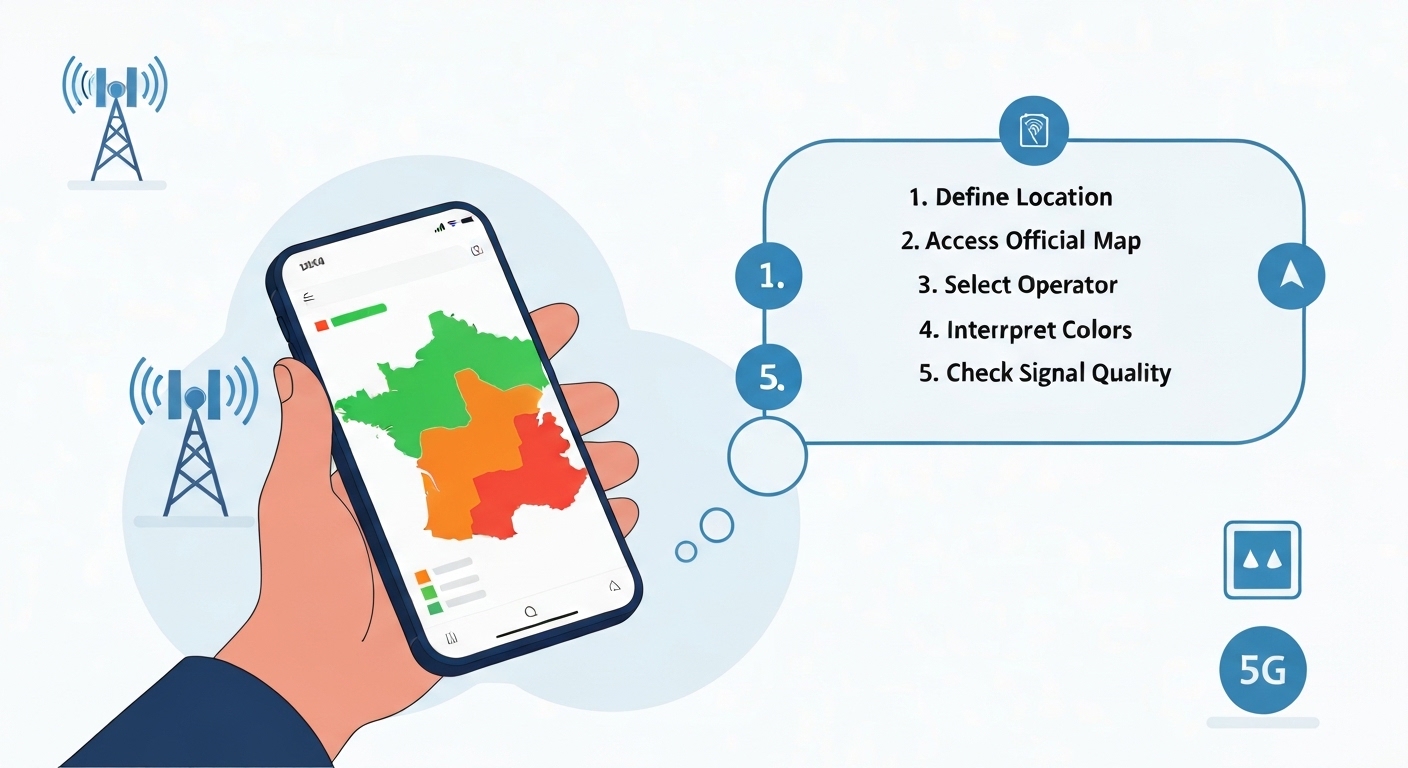
How to check mobile coverage in 6 simple steps (official arcep method)
To obtain a reliable, regulator-approved assessment of your mobile signal, follow this structured six-step process using France's official tools. This method leverages the latest Q2 2025 departmental data from ARCEP.
- Access the Official Tool: Navigate to the "Mon réseau mobile" website (monreseaumobile.fr) or the ARCEP "Cartes et données" portal. These are the primary sources for unbiased, comparative coverage maps.
- Select Location and Period: Choose your department or commune and ensure you are viewing the most recent data period (e.g., Q2 2025). Coverage evolves, and outdated maps are misleading.
- Enter Your Precise Address: For granularity at a 10-100 meter resolution, input your full address or postal code. A vague search (e.g., just a city name) will not provide accurate results for your specific building or street.
- Choose Service and Operator: Select the service type (Voice/SMS, Mobile Internet, or 5G) and toggle between the four main operators (Orange, SFR, Bouygues Telecom, Free) to compare.
- Analyze the Coverage Map: View the interactive map. The color-coded zones will indicate the predicted coverage level (e.g., "Très bonne couverture") for your selected parameters.
- Review Supplementary Data: Check the available layers for indoor coverage estimates and note any "zones à couvrir" (areas to be covered) or evolution indicators that show recent network improvements.
By systematically following these steps, you move from guesswork to a data-driven decision. The next step is mastering the tool itself to decode exactly what these maps are telling you about signal quality.
Mastering the interactive map: your key to decoding signal quality
The "Mon réseau mobile" interactive map is your central dashboard for signal intelligence. Mastery of its interface, enhanced in the 2025 update, is what separates a superficial glance from a professional-grade analysis. Its key elements are designed to deliver precise, actionable insights.
The core components you must command include:
- The Search Bar: Your entry point for specific addresses, postal codes, or landmarks.
- Layer Toggles: These buttons allow you to filter the display by service (Voice, Internet, 5G) and by operator, enabling direct, visual comparisons.
- Zoom Function: Essential for achieving commune-level granularity. Zoom in to see how coverage can change block by block.
- Coverage Indicators: Beyond simple colors, look for specific pins marking 5G commercial sites deployed in Q2 2025 and icons for reporting issues ("J'alerte l'Arcep").
- Detail Panels: Clicking on a zone often reveals a panel with precise terminology and notes on indoor/outdoor service availability.
Navigating this map effectively means starting broad (department view) and drilling down to your exact location, toggling between operators to see whose "très bonne couverture" zone you fall within. This visual decoding leads us directly to the critical task of interpreting the map's universal language: its color spectrum.
From green to red: how to interpret coverage map colors and zones
The transition from green to red on a coverage map tells a clear story of connectivity probability. Interpreting this color code, standardized by ARCEP in its Q2 2025 departmental cards, is fundamental to making an informed choice.
Green zones ("Très bonne couverture") represent the highest guarantee. Here, the operator's network is predicted to successfully complete and maintain a call outdoors 95% of the time and support data exchange. This level often includes reliable indoor coverage in most building types. Yellow or orange zones indicate fair or partial coverage, where service is available but may be less consistent, with potential for dropped calls or slower data speeds, especially indoors. Red zones signify "No Service" or areas where the success rate falls below the 95% threshold, meaning a reliable connection is not predicted.
Furthermore, maps use shaded areas to show population coverage percentages and distinct icons for newly deployed 5G commercial sites. A crucial best practice is to always verify the data period (e.g., Q2 2025) in the map legend, as networks are constantly evolving. Understanding this visual language requires fluency in the specific technical terms used, which we will now define.
Très bonne couverture vs. no service: the 5 key terms you must know
To accurately interpret your check results, you must understand the official terminology:
- Couverture: The ability to connect to a network. Officially, this means a 95% probability of establishing and maintaining a 1-minute call outdoors.
- Très Bonne Couverture: The highest level, indicating reliable outdoor service and data access, with indoor service available in most typical buildings.
- Qualité de Service (QS): The technical performance metrics of the network, including accessibility and maintained bitrate, which underpin coverage.
- No Service: An area where the network's call success rate is below the 95% threshold, indicating unreliable or non-existent connectivity.
- 5G Couverture: Specifically refers to areas with deployed commercial 5G sites, as shown on the latest ARCEP maps.
Faq: 5g, indoor coverage, and why your signal varies – your questions answered
Q: Is 5G available at my address?
A: Check the "5G" layer on the "Mon réseau mobile" map or the latest ARCEP Q2 2025 departmental card, which shows all commercial 5G sites.
Q: Why is my indoor signal different from the outdoor map prediction?
A: Maps show theoretical outdoor coverage. Indoor reception is an estimate and can be significantly weakened by building materials (concrete, metal). The "très bonne couverture" level accounts for this in most, but not all, cases.
Q: Why does my signal strength vary?
A: Coverage is a statistical prediction. Real-world factors like network congestion (number of simultaneous users), weather conditions, physical obstacles, and your movement can cause momentary variations.
Conclusion
You now possess the complete blueprint to move from uncertainty to absolute clarity on your mobile connectivity. We’ve moved beyond simple definitions to a regulator-grade verification process, equipping you with the methodology to secure reliable service at your exact location.
Imagine the confidence of knowing your new business site has guaranteed 4G/5G coverage for operations, or the peace of mind that your future home won’t be a dead zone. This isn't hypothetical. With the ARCEP's Q2 2025 data and the updated "Mon réseau mobile" tool, you have concrete proof of network performance before you sign a contract or make an investment. The cost of inaction is quantifiable: operational downtime, failed transactions, and the frustration of being locked into a service that doesn't work where you need it most.
The landscape is not static. 5G deployment is accelerating, and coverage maps are updated quarterly. The decision you make today must account for this evolution. Can you afford to base a critical connectivity plan on data that is six months old? Is your current provider's "excellent coverage" claim verifiable at your precise address? What is the financial and operational risk if your key site falls into a yellow "fair coverage" zone instead of a solid green one?
The complexity ends here. You are no longer guessing or relying on marketing. You have the official procedure, the map-decoding skills, and the terminology to act with authority.
For projects where connectivity is non-negotiable—critical infrastructure, multi-site deployments, or real estate development—these general variables demand a tailored analysis. Let's translate this knowledge into a concrete plan for your specific needs.
Discuss your project requirements with our experts for a personalized coverage analysis. 📡
Sources
- https://www.arcep.fr/fileadmin/reprise/dossiers/mobile/couverture-mobile-methodologie.pdf
- https://www.arcep.fr/nos-sujets/monreseaumobile-comparer-couverture-qualite-service-operateurs-mobiles.html
- https://www.service-public.gouv.fr/particuliers/actualites/A18560
- https://www.fratel.org/documents/2019/10/Document-Fratel-couverture-et-qualit%C3%A9-de-service-mobiles.pdf